Economic activity
Auckland's GDP
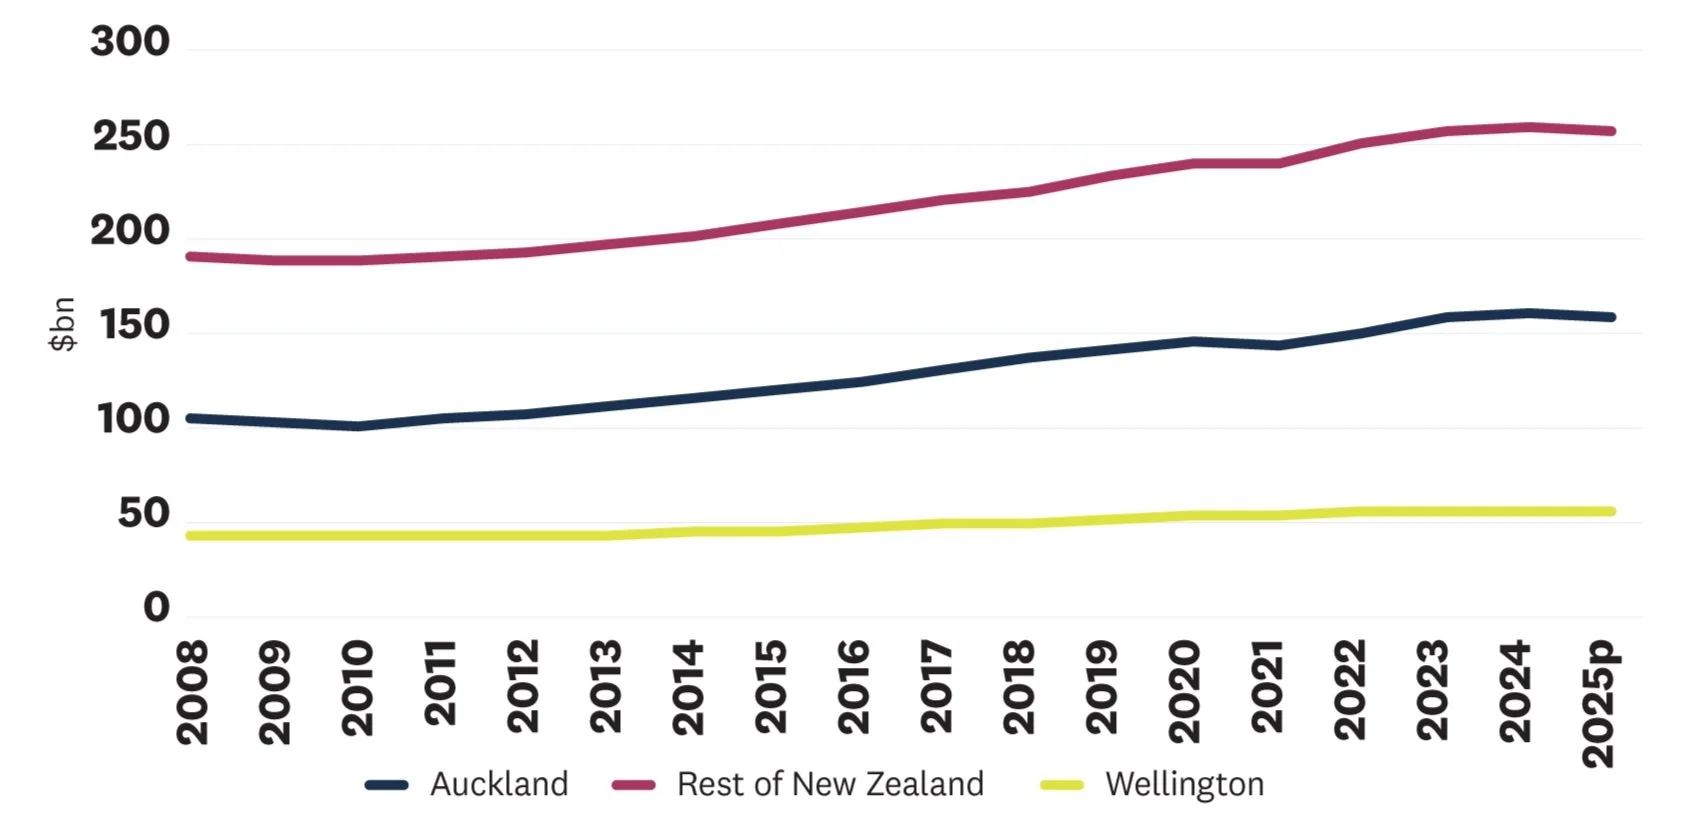
GDP (March year, 2026 Prices, $bn)
Real GDP growth rate (March year)

Tāmaki Makaurau Auckland’s economy grew by a small amount in the year to March 2026, following a decline in GDP in the prior 12 months.
Auckland’s GDP was $172bn in the year to March 2026, 0.6 per cent higher (in real terms) than the previous year. This marks a slight recovery following a 1.2 per cent decline in the year to March 2025, which was the weakest annual GDP result since 2009.
The year to March 2025 saw the largest percentage point decline in GDP since the GFC, even exceeding the pandemic period.
Auckland’s economy began to regain momentum through 2026 following the weaker conditions of the previous year. Provisional data for the year to June 2026 shows a growth rate of 1.5 per cent. However, the pace of recovery remains subdued, relative to the post-pandemic recovery and pre-pandemic growth rates. Despite the economy beginning to stabilise, the effect of the downturn is still evident across the region.
These GDP growth rates are broadly similar to the rest of New Zealand, although Auckland has fared slightly worse. This is consistent with historical trends – Auckland tends to outperform the rest of the country during boom periods, but experiences a slightly more adverse impact of downturns in the economic cycle.
-
Auckland’s real GDP was $172bn in the year to March 2026.
This was up from $171bn in the year to March 2025, but lower than the $173bn in the year to March 2024 (both in real terms).
Auckland continues to contribute around 38% of New Zealand’s GDP. This is significantly higher than Auckland’s share of the population (34%), and almost triple the contribution of Wellington, the next largest region.
-
Auckland’s GDP grew by 0.6% in the year to March 2026, after decreasing by 1.2% in the year to March 2025 (both in real terms).
The reduction in real GDP in 2025 was the weakest annual result since the GFC, exceeding the contraction recorded during the pandemic.
Provisional data for the year to June 2026 provides evidence of further recovery, with growth of 1.5%.
Auckland’s growth was slightly below that of the rest of New Zealand (1.0% in 2026), but above Wellington’s (0.1%).
Historically, Auckland’s real GDP has grown faster than the rest of New Zealand, increasing Auckland’s share of national GDP from 34% in 2010 to 38% today.
Source: Stats NZ: Regional GDP – RNA. Infometrics: Regional Economic Profile
What’s driving economic performance?
% share of GDP by industry (2026)

Real GDP growth rate by industry (2026)
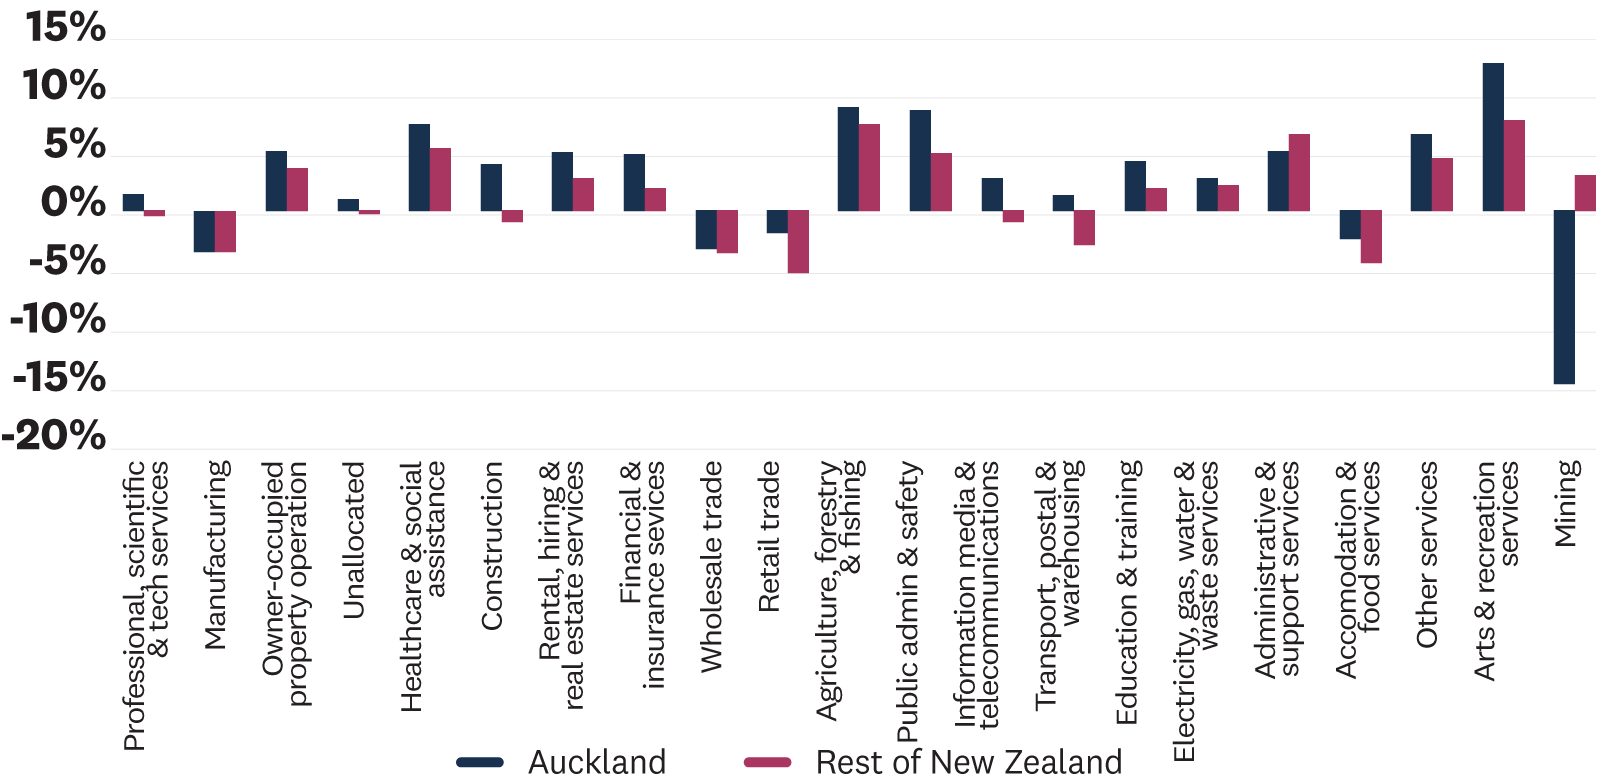
Tāmaki Makaurau Auckland’s economy stabilised in the year to March 2026, with growth returning across most industries following the broad contraction recorded in the previous 12 months.
After a decline in the year to March 2025, Auckland’s emerging recovery has been led by strong growth in wholesale and retail trade, as well as sections of its higher-value service industries, which make up a larger share of Auckland’s economy than elsewhere in New Zealand. ‘Professional, scientific and technical services’ remained Auckland’s largest industry, contributing $19bn of GDP, and experienced higher growth (2.1%) than the average across all industries (0.6%).
Only the ‘construction’ and ‘mining’ industries recorded reductions in real GDP over the year to March 2026. The construction sector has been the primary industry drag on economic activity, declining by 6.2 per cent in the year to March 2026, following an even larger reduction in the previous year (-9.1%). This equates to a decrease in GDP of around $1.7 billion over the last 2 years.
Overall, the 2026 data points to initial signs of recovery across Auckland’s service-led economy, even as specific sectors or industries continue to lag.
-
Auckland’s largest industries by GDP (ANZSIC Level 1) remain ‘professional, scientific and technical services’ and ‘financial and insurance services’, contributing a combined $35bn of GDP in the year to March 2026.
Industries providing high-value services accounted for 37% of Auckland’s GDP in the year to March 2026, compared with 27% for the rest of New Zealand.
Primary industries contribute very little to Auckland’s GDP (0.3%) relative to the rest of New Zealand (9%).
Auckland’s economy is well diversified. The largest industry (‘professional, scientific and technical services’) contributes 11% of Auckland’s GDP. Across the other 66 territorial authorities, the average GDP contribution for the largest industries is 20%.
-
Growth was widespread in the year to March 2026, with all industries, except for mining and construction, recording an increase in real GDP.
‘Wholesale trade’ was the largest contributor to Auckland’s growth in dollar terms, increasing by $470 million. This was followed by ‘professional, scientific and technical services’ (+$394 million), ‘retail trade’ (+$219 million) and ‘rental, hiring and real estate services’ (+$188 million).
Relative to the rest of New Zealand, Auckland saw considerably stronger growth in ‘electricity, gas, water and waste services’, while it experienced a larger decline in ‘construction’ and ‘arts and recreation services’. Over the last two years, ‘health care and social assistance’ and ‘rental, hiring and real estate services’ have seen consistent growth.
Source: Infometrics: Regional Economic Profile
Real GDP per capita
Real GDP per capita (March year, 2026 Prices)

Tāmaki Makaurau Auckland’s economy generated GDP per capita of $95,000 in the year to March 2026. This was a 0.3 per cent increase from the year to March 2025, following a decrease during the previous 12 months.
When spread over Auckland’s population, the $172bn GDP generated in the year to March 2026 represents $95,000 per person. GDP per capita is often considered a proxy for the average standard of living.
Real GDP per capita increased by 0.3 per cent in the year to March 2026. Despite this increase, real GDP per capita remains lower than at its peak in the year to March 2024.
-
Auckland’s real GDP per capita was $95,000 in the year to March 2026, up from $94,000 in the year to March 2025.
This represented an increase of 0.3%, following a 2.2% decline in the prior year.
Auckland’s GDP per capita remains below the year to March 2024 level of $96,000.
Auckland’s GDP per capita is around 20% higher than the rest of New Zealand.
This gap has gradually developed since 2010. It illustrates the effect of Auckland’s greater concentration of higher-value economic activity.
Auckland continues to have a lower real GDP per capita than Wellington, but the gap has narrowed as a result of Wellington experiencing a 0.4% decline over the last year.
Sources: Real GDP growth, real GDP per capita, inputs for Auckland GDP index – Infometrics: Regional Economic Profile
Auckland Economic Monitor
A summary of key economic information about the region
Auckland’s economy
-
![Economic activity]()
Economic activity
While Tāmaki Makaurau Auckland’s economy continued to grow in the year to March 2024, provisional estimates show a slight decline in economic output over the last 12 months.
-
![Businesses]()
Businesses
GDP output per worker (labour productivity) in Tāmaki Makaurau Auckland fell (in real terms) -0.7 per cent in the year to March 2024 and has likely stagnated or declined slightly in the year to March 2025.
-
![The labour market]()
The labour market
Tāmaki Makaurau Auckland’s workforce is growing, and continues to become more diverse and skilled.
-
![Economic confidence]()
Economic confidence
Tāmaki Makaurau Auckland's consumer confidence has fluctuated over the last 12 months, as part of a complex - yet promising - trend in sentiment.
-
![Visitor economy]()
Visitor economy
Tāmaki Makaurau Auckland offers the first taste of New Zealand for many international visitors. International tourism has recovered strongly, but it is not yet back to pre-COVID-19 levels.
-
![Community]()
Community
Tāmaki Makaurau Auckland is a young, diverse and growing region. It is home to 34 per cent of New Zealand’s population.
-
![]()
Emissions
Tāmaki Makaurau Auckland's ongoing efforts to manage and reduce emissions are part of its commitment to a greener and more sustainable future.