The people of Auckland
Tāmaki Makaurau Auckland comprises a rich diversity of people, but has some systemic challenges related to education, housing, health, and employment outcomes for various communities.
Auckland and its people are shaped by a variety of factors including education, home ownership, health, employment, and income disparities. An analysis of 2023 Census data reveals insights into the challenges and opportunities faced by different communities within the region.
| Qualification Level | Auckland | Rest of New Zealand |
|---|---|---|
| No qualification | 13.2% | 16.9% |
| Level 1 certificate | 8.0% | 11.3% |
| Level 2 certificate | 8.1% | 10.6% |
| Level 3 certificate | 12.9% | 12.6% |
| Level 4 certificate | 6.7% | 9.8% |
| Level 5 diploma | 4.5% | 5.4% |
| Level 6 diploma | 4.5% | 4.9% |
| Bachelor degree and Level 7 qualification | 19.0% | 13.8% |
| Post-graduate and honours degrees | 7.1% | 5.7% |
| Masters degree | 5.8% | 3.7% |
| Doctorate degree | 1.0% | 1.0% |
| Overseas secondary school qualification | 9.1% | 4.3% |
-
In 2024, Auckland’s population approached 1.8 million, representing 34 per cent of New Zealand’s residents. The region has a young population relative to the rest of the country, with only 13 per cent of residents aged 65 and older, significantly lower than the national average. Over 31 per cent of residents identify as Asian, more than 16 per cent as Pacific peoples, and 12 per cent as Māori, with Auckland being home to nearly two-thirds of New Zealand’s Pacific population and 24 per cent of the Māori population.
The European population remains the largest ethnic group (50%), particularly in north Auckland local board areas like Rodney (85%), Hibiscus and Bays (76%) and Devonport-Takapuna (66%), but also Franklin (77%), Waitākere Ranges (70%) and Ōrākei (68%). Meanwhile, the Māori community is strongly concentrated in the southern local board areas of Manurewa (24,900), Papakura (17,800) and Franklin (14,000), as well as Henderson-Massey (22,600) in the west.
The Howick local board area has by far the largest Asian population in Auckland and is the only local board other than Puketāpapa where over 50 per cent of its population is Asian. The Asian population is well distributed around the Auckland region, with Henderson-Massey, Upper Harbour, Whau, Albert-Eden, Ōtara-Papatoetoe and Kaipātiki all with Asian populations exceeding 30,000.
Pacific communities are strongly concentrated in three southern local board areas, with Māngere-Ōtāhuhu, Ōtara-Papatoetoe and Manurewa accounting for 47 per cent of Auckland’s Pacific population. Henderson-Massey and Maungakiekie-Tāmaki also have Pacific populations of over 20,000.
Auckland has rich cultural diversity, with 43 per cent of its residents born overseas. This contrasts sharply with the rest of New Zealand, where 21.8 per cent of the population was born abroad. Since 2018, the proportion of Auckland residents born overseas has seen only a slight increase from 41.5 per cent, but is up from 32 per cent two decades ago.
This diversity is further reflected in the region’s language profile. While 92 per cent of Aucklanders speak English (lower than the rest of the country - 96.5%), around one-third of people speak more than one language, with significant communities speaking Chinese (Northern, Sinitic and Yue), Samoan, Hindi, te reo Māori, Tongan, Panjabi and Tagalog (Filipino).
-
Auckland’s educational landscape demonstrates a strong commitment to post-secondary learning. In Auckland, 19 per cent of residents hold a bachelor’s degree or Level 7 qualification, 0.4 per cent higher than in 2018, and exceeding the rest of New Zealand in 2023(13.8%). The rate of postgraduate and honours degrees or higher qualifications in Auckland is also higher at 13.9 per cent, compared to 10.4 per cent across the rest of New Zealand, reinforcing the region’s reputation as a hub for academic achievement and professional advancement.
The percentage of individuals with no qualifications in Auckland fell from 14.5 per cent in the 2018 Census to 13.2 per cent in 2023, which is lower than the 16.9 per cent for the rest of New Zealand. There are, however, significant disparities in educational attainment between ethnic groups. The proportion of Māori with no formal qualifications (21.7%) is much higher than the rest of the population, for example.
In terms of study participation, Auckland has a slightly higher proportion of the population enrolled in full-time study (22.2%) compared to the rest of New Zealand (20.2%).
-
Dwelling number and ownership
The narrative surrounding Auckland’s housing market reflects both the evolving metrics of affordability and the continual barriers faced by residents striving for homeownership. While there has been a recent improvement in affordability—evidenced by a drop in the average price to income ratio from 10 in 2022 to 7.8 in 2024 —as a result of a mix of factors (e.g. new housing supply, high interest rates, population changes), the reality remains that housing continues to be ‘severely unaffordable’ for many residents, and home ownership is still a significant concern.
While 60 per cent of households in Auckland own (or partly own) the dwelling they reside in, this figure is lower than the rest of New Zealand (69%) and other major urban centres like Wellington (66%) and Christchurch (65%). Overall, the Auckland home ownership rate has remained the same since 2018 but has declined slightly since 2013.
Home ownership rates vary significantly within Auckland geographically and across ethnic groups. Excluding the Waitematā local board area (39.5%), the lowest home ownership rates are seen in the south Auckland local board areas of Māngere-Ōtāhuhu (41%) and Ōtara-Papatoetoe (42%), while the highest rates are in Aotea/Great Barrier (78.5%), Rodney (75%), Hibiscus and Bays (74%), Waiheke (73.5%) and Waitākere Ranges (73%).
Total dwellings in Auckland have increased by 11.9 per cent since the 2018 Census, and occupied dwellings have grown on average by 1.8 per cent annually from 2018-2023, surpassing the 1.1 per cent annual growth rate between 2013-2018. This growth has been driven by a large increase in joined dwellings (i.e., townhouses and apartments), with a slight decline in standalone houses.
Quality and crowding of dwellings
The quality of Auckland homes overall has shown positive changes; however, a prominent concern is that lower-quality dwellings tend to be located in areas with a higher proportion of overcrowded households.
Since 2018, the proportion of dwellings in Auckland that are either always or sometimes damp has fallen from 25 per cent in 2018 to 20 per cent in 2023. Similarly, the number of dwellings with mould issues has decreased from 21 per cent to 17 per cent. South Auckland continues to report the highest levels of these issues, and also has the greatest concentration of crowded households.
The average household in Auckland remains steady at 3.0 occupants, unchanged since 2013. However, local board areas such as Māngere-Ōtāhuhu, Ōtara-Papatoetoe and Manurewa have larger household sizes, all above 3.5. These areas are also where the highest proportion of crowding exists in the region with 25.4, 24.4 and 19.7 per cent, respectively, being reported as ‘crowded’. Of these crowded dwellings, 42 per cent in Māngere-Ōtāhuhu are severely crowded.
General health
Health statistics present a mixed picture for Auckland’s residents. On one hand, the city boasts excellent drinking water quality and life expectancy rates of 83.4 years, which surpass national averages. Conversely, mental health challenges remain significant; data shows increased presentation rates for mental health issues, alongside a suicide rate of 0.9 per 10,000 people—well above the national average.
-
Since the 2018 Census, one of the most striking shifts is the significant rise in remote work — a trend that has doubled over the past five years. In 2018, only 8.7 per cent of Aucklanders worked from home, a figure that rose to 18.2 per cent in 2023. This dramatic change reflects the lingering impact of COVID-19, which has reshaped workplace dynamics and necessitated greater flexibility. The rest of New Zealand has a similar proportion of people working at home (17.5%) but also had more individuals working from home prior to the pandemic (13.5%).
Driving remains the most prevalent means of getting to work, with approximately 55 per cent of Aucklanders using private cars, trucks or vans, slightly higher than the 54.8% for the rest of the country. This figure has fallen since 2018 (59.5%). Public transportation usage also tells a nuanced story; while Auckland still relies more on buses and trains (5.7% and 1.6%, respectively) compared to the rest of the country (2.6% and 1.2%), the overall proportion of commuters using public transport has dropped from 10.7 per cent in 2018 to around 7.8 per cent in 2023 due to more people working from home.
In 2023, 15.6 per cent of Aucklanders were either self-employed or employers, a slight increase from 2018 (15.2%), but down from 2013 (18.4%). The rest of New Zealand has a higher percentage of self-employed individuals or employers at 16.5 per cent. This difference is driven by a slightly greater proportion of people who are employers across the rest of New Zealand. Conversely, Auckland has a larger share of paid employees, with 83.6 per cent of its workforce falling into this category, compared to 82 per cent in the rest of the country.
Aucklanders also tend to work longer hours, with 68.7 per cent reporting schedules of 40 hours or more, in contrast to 62.2 per cent in the rest of New Zealand. Notably, 54.1 per cent of Auckland’s workforce is engaged in 40-49 hour workweeks.
Income disparities
Auckland’s median household income was $116,800 in 2023, an increase of $23,000 (24%) since 2018. Inflation increased 20.5 per cent during this intercensal period. The median household income across the rest of New Zealand ($85,000) was significantly below Auckland, but grew at a faster rate (42%) between 2018 and 2023.
While the trends above are encouraging, there are income disparities across Auckland that are entrenched. At the local board level, for example, median household incomes are, in general, significantly higher in central (Ōrākei, Albert-Eden), north (Upper Harbour, Devonport-Takapuna, Kaipātiki) and east (Howick) Auckland compared to south Auckland. Such inequalities can hinder economic mobility and perpetuate systemic barriers for those from lower-income backgrounds.
Social deprivation has also increased since 2018, with the proportion of the population in the highest deprivation deciles (9 and 10) increasing from 21.3 per cent to 22.8 per cent.
Source: 2023 New Zealand Census, Dwellings and households in Tāmaki Makaurau / Auckland: Results from the 2023 Census
Auckland Economic Monitor
A summary of key economic information about the region
Auckland’s economy
-
![Economic activity]()
Economic activity
While Tāmaki Makaurau Auckland’s economy continued to grow in the year to March 2024, provisional estimates show a slight decline in economic output over the last 12 months.
-
![Businesses]()
Businesses
GDP output per worker (labour productivity) in Tāmaki Makaurau Auckland fell (in real terms) -0.7 per cent in the year to March 2024 and has likely stagnated or declined slightly in the year to March 2025.
-
![The labour market]()
The labour market
Tāmaki Makaurau Auckland’s workforce is growing, and continues to become more diverse and skilled.
-
![Economic confidence]()
Economic confidence
Tāmaki Makaurau Auckland's consumer confidence has fluctuated over the last 12 months, as part of a complex - yet promising - trend in sentiment.
-
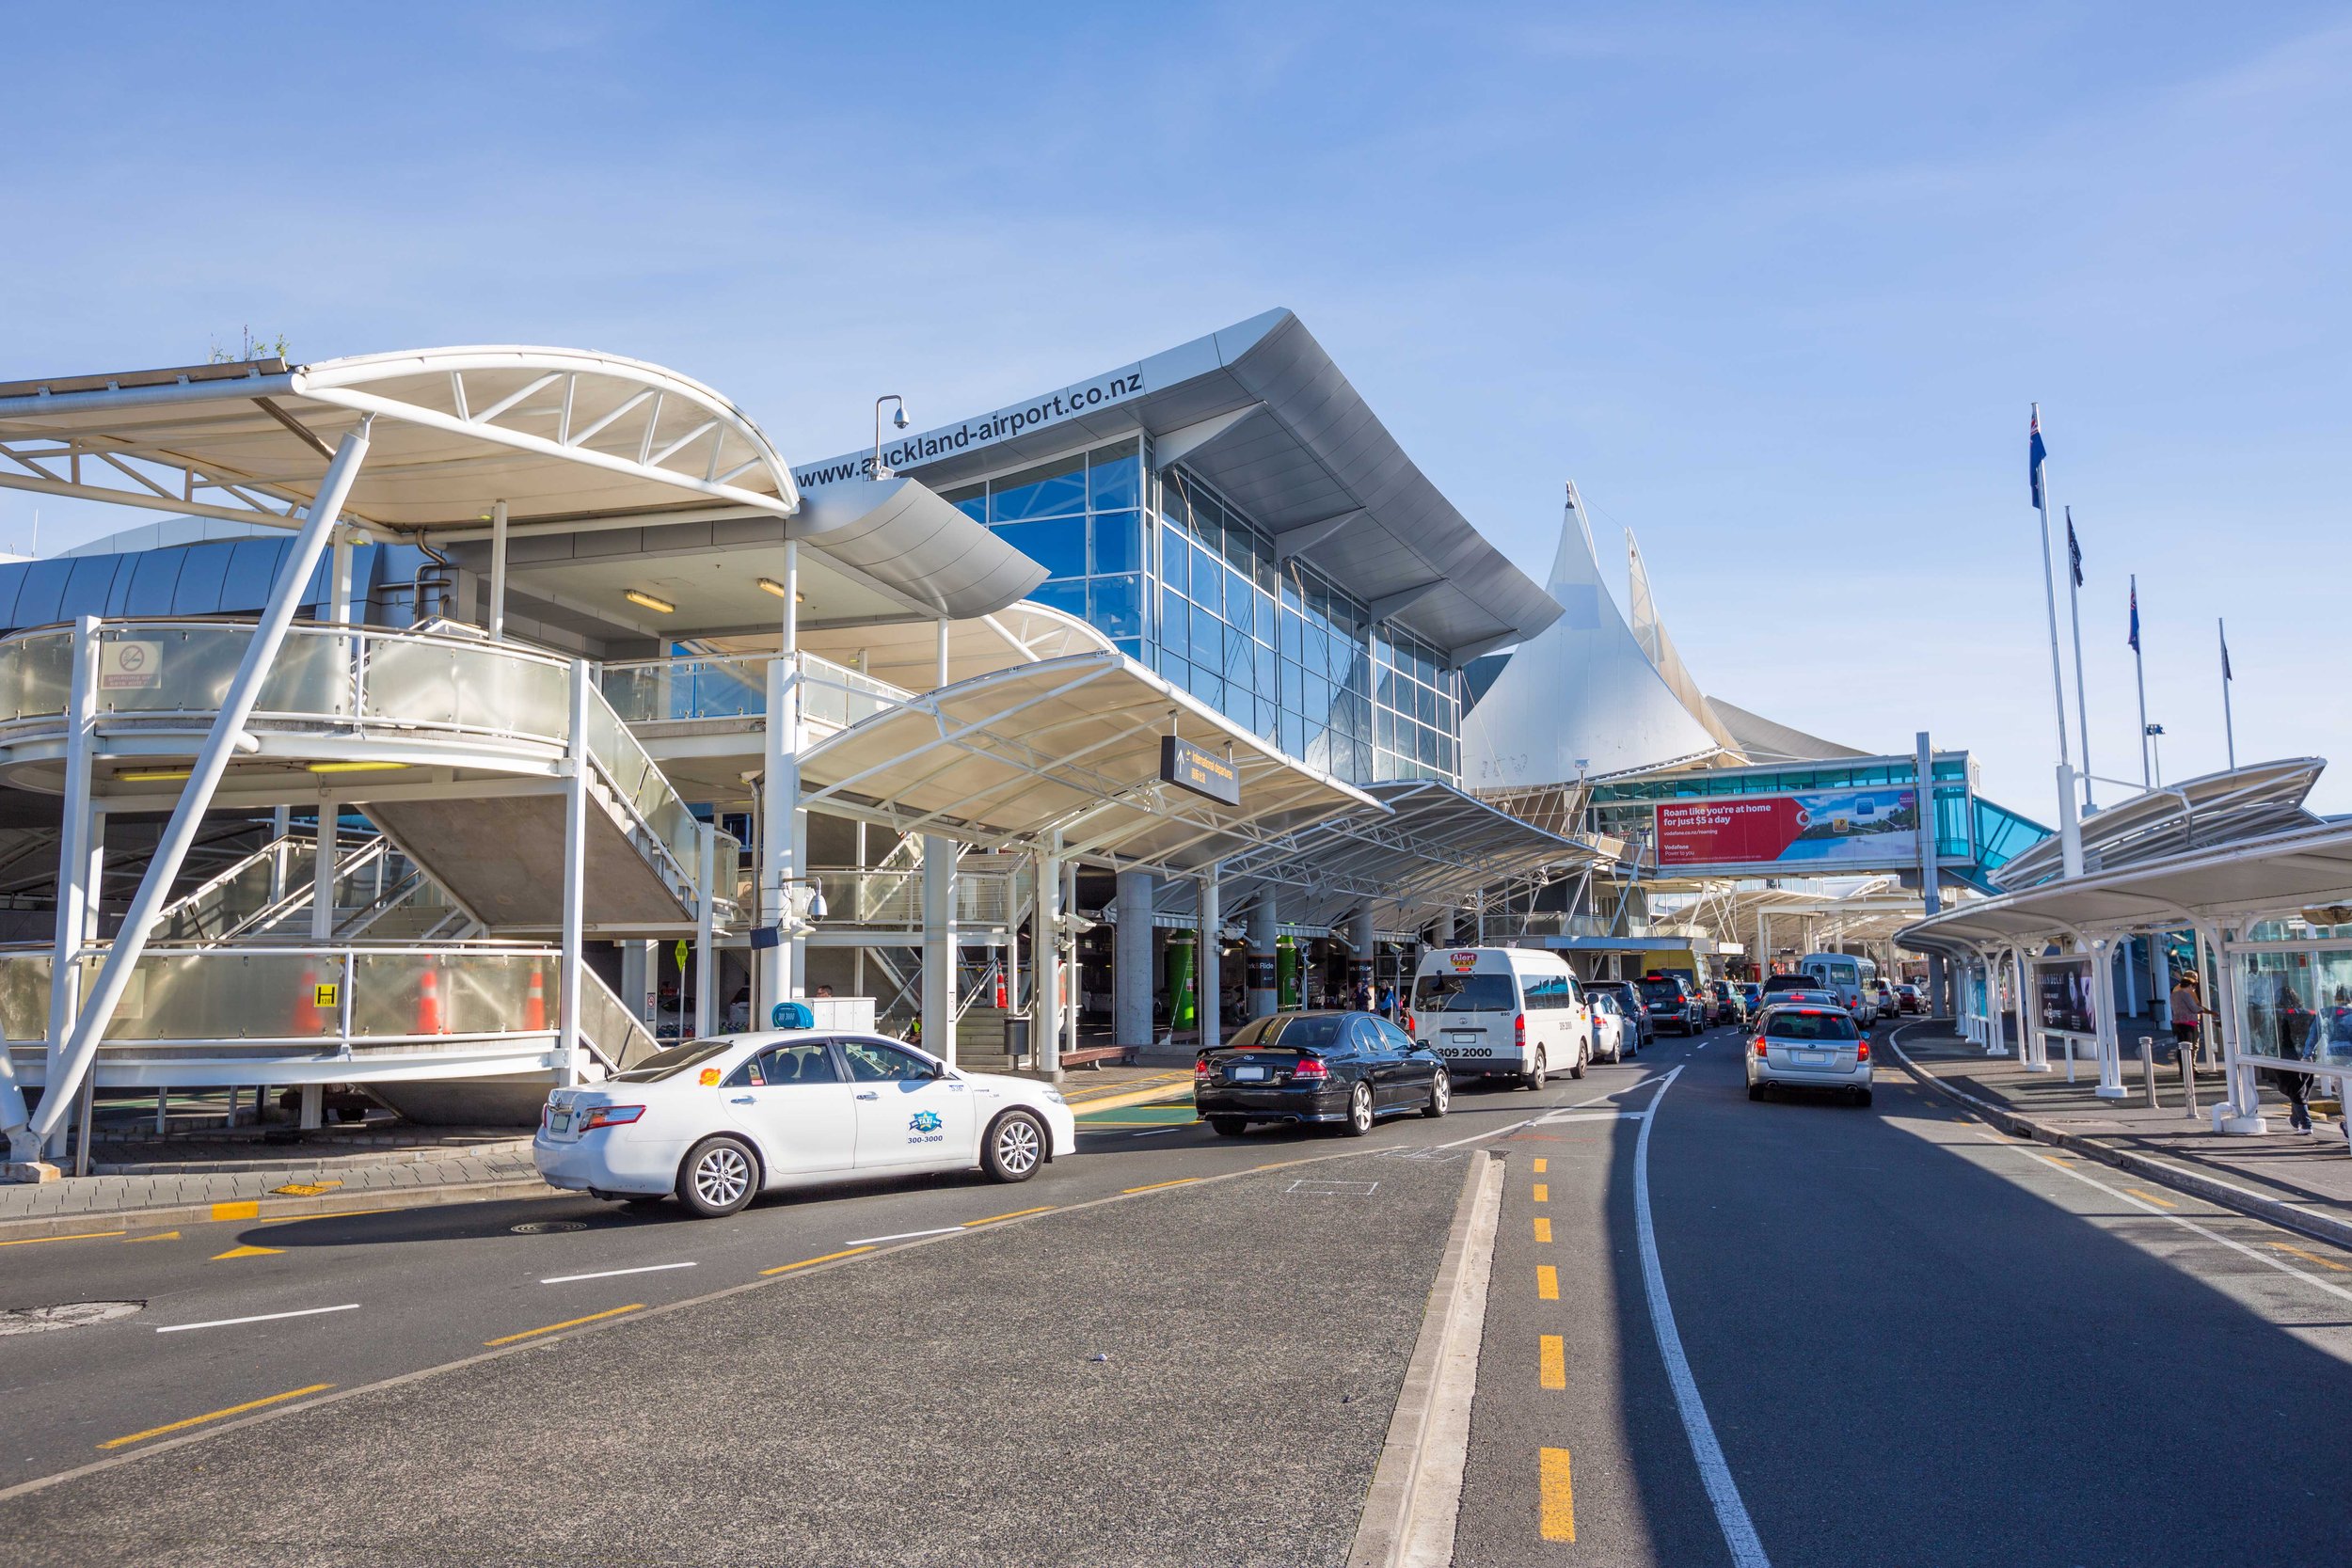
![Visitor economy]()
Visitor economy
Tāmaki Makaurau Auckland offers the first taste of New Zealand for many international visitors. International tourism has recovered strongly, but it is not yet back to pre-COVID-19 levels.
-
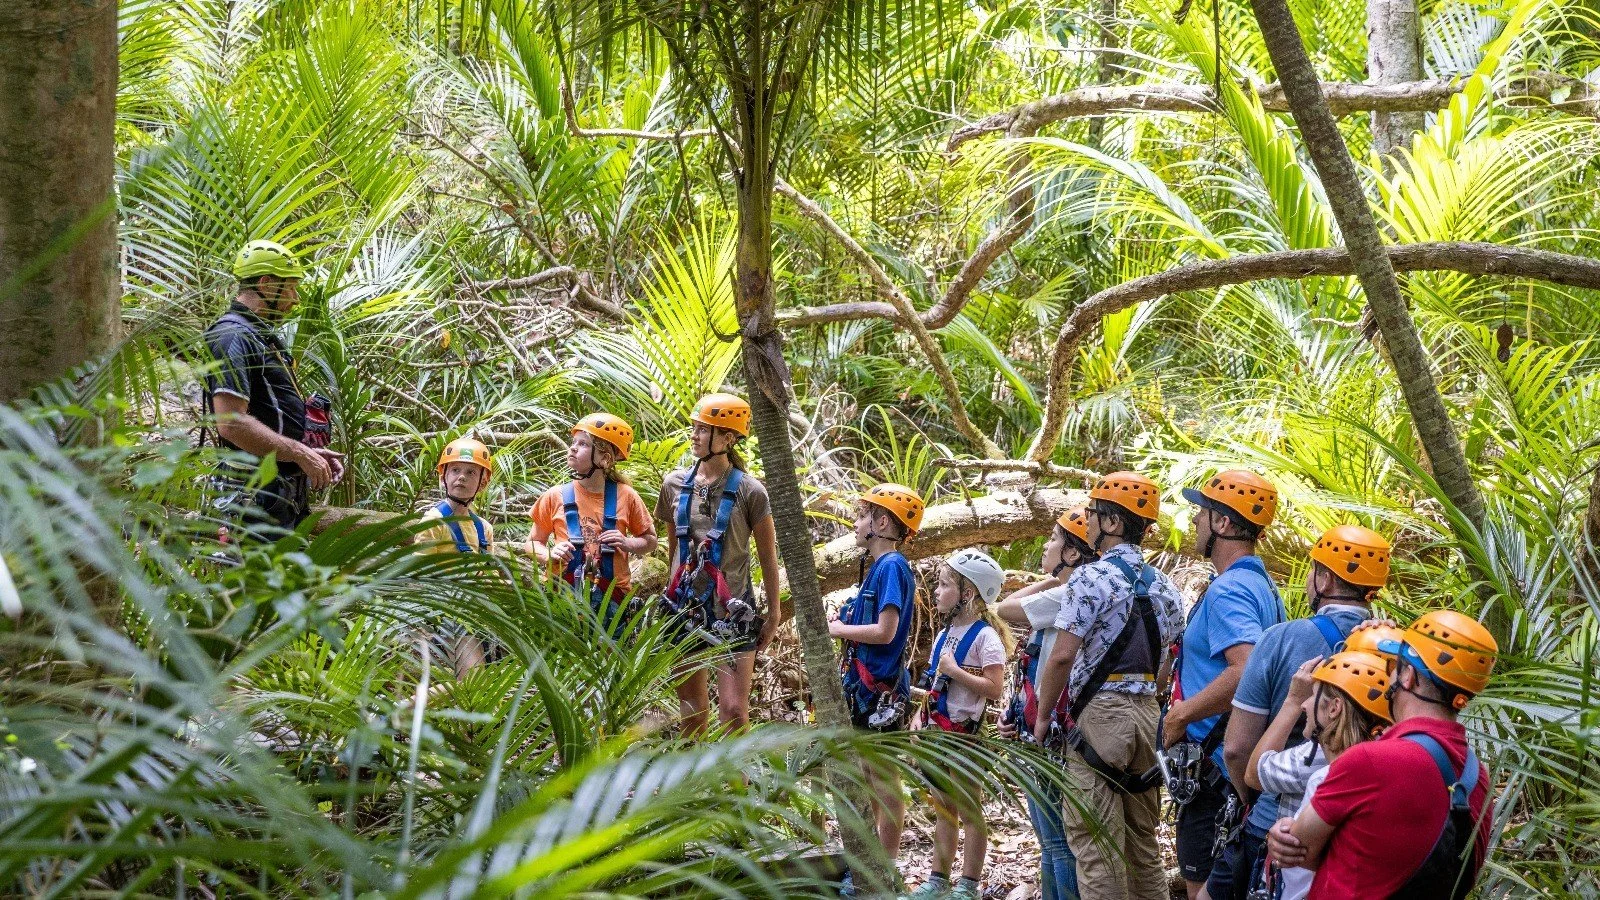
![Community]()
Community
Tāmaki Makaurau Auckland is a young, diverse and growing region. It is home to 34 per cent of New Zealand’s population.
-
![]()
Emissions
Tāmaki Makaurau Auckland's ongoing efforts to manage and reduce emissions are part of its commitment to a greener and more sustainable future.